

『Flow Meter Pressure Drop Chart Interpretation: Balancing Head Loss vs Pumping Energy Costs』Related information(flow rotameter|digital flow meter|balo meter|hydraulic flow meter|volumetric meter|positive displacement meter|pitot tube flow meter|displacement meter|cfm meter|variable area flow meter|inline flow meter|differential pressure flow meter|calibrated flow meter|velocity meter|paddle wheel flow meter|oval gear flow meter|anemometer hvac|multiphase flow meter|doppler flow meter|thorpe tube flowmeter|heat flow meter)
Flow Meter Pressure Drop Chart Interpretation: Balancing Head Loss vs Pumping Energy Costs
Quick Answer: A flow meter pressure drop chart shows the permanent head loss caused by a meter at specific flow rates. Use the chart at your maximum flow rate and actual fluid viscosity to compare meter types. On DN80 and larger lines, a small difference in bar can add thousands of dollars in pumping energy cost over five years.
Many engineers only check accuracy, price, and line size. Pressure drop data gets skipped. That is a mistake on continuous processes. On a 24 hour water line or fuel line, the flow meter becomes a fixed energy loss. Silver Automation Instruments has seen this on customer sites in Southeast Asia, the Middle East, and Latin America. The pressure drop chart is not just a datasheet curve. It tells you what the pump will pay every year.
Which Flow Meter Types Have the Lowest Pressure Drop
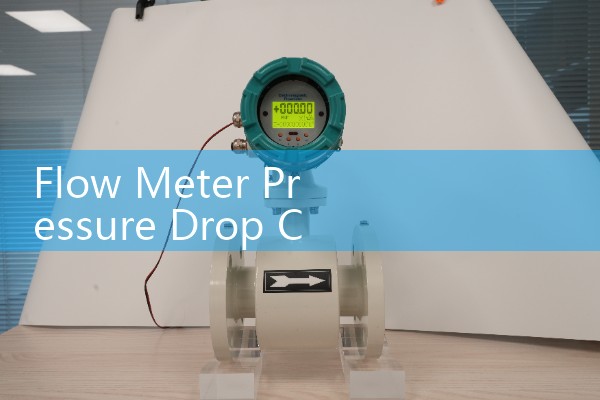
Full-bore electromagnetic flow meters have almost no permanent pressure drop. The sensor is a straight tube with no moving parts and no restriction. A DN100 electromagnetic flow meter may show 0.03 bar at 200 m3/h on water. That is close to the pipe loss alone. Many of these meters also output 4-20 mA HART and include a PT100 input for temperature compensation. For a surface water line with conductivity 800 µS/cm, a full-bore electromagnetic flow meter is a direct fit.
Inline ultrasonic flow meters often use a straight-through spool or a small reduction. Pressure drop can stay below 0.15 bar at 200 m3/h. Clamp-on ultrasonic meters add zero pressure drop because the transducers sit outside the pipe. This matters on a seawater flow meter for a desalination plant in the Middle East where high-pressure pumps run around the clock.
Coriolis mass flow meters are different. The measuring tubes are bent or curved. A DN80 Coriolis meter may show 0.5 to 1.2 bar at high flow. That loss is acceptable when you need direct mass flow, density, and temperature. But you must budget for the pump load. A vortex flow meter uses a bluff body in the flow path. A DN50 vortex meter may show 0.2 to 0.5 bar at maximum flow on water. Oval gear and other positive displacement meters can show 0.3 to 1.5 bar depending on viscosity and line size. Thermal mass flow meters for gas have a small probe and usually add very low pressure drop in the pipe.
How to Read the Pressure Drop Chart Without Misleading Yourself
Here is the thing. Most pressure drop charts are based on water at 20 °C. Your process fluid may not be water. For a 100 cP syrup, the pressure drop can be much higher in a Coriolis or oval gear meter. Ask the supplier for a chart calculated for your viscosity and specific gravity.
Check the flow rate on the chart. Use the maximum flow rate you expect, not the average. Pressure drop rises with the square of velocity. If you size the meter at 100 m3/h but the peak is 140 m3/h, the actual loss is not 40 percent higher. It can be nearly double.
Look for permanent pressure loss, not the differential pressure value. Differential pressure flow elements like orifice plates show a DP value. The permanent loss is often 40 to 70 percent of that DP. A DP chart can say 500 mbar and the pump still pays 350 mbar after the plate. That hidden loss matters.
Compare meters at the same flow rate, same line size, and same fluid properties. A pressure drop chart from one brand may use mbar while another uses kPa. Convert units before you decide. 1 bar is 100 kPa. 100 mbar is 10 kPa.
Pumping Energy Cost Calculation in Plain Terms
Use this formula to estimate shaft power lost to the flow meter:
Power in kW = (flow rate in m3/h × pressure drop in bar) / (36 × pump efficiency)
Example. A water transfer line runs 100 m3/h. A flow meter adds 0.5 bar permanent loss. Pump efficiency is 0.65.
Power loss = (100 × 0.5) / (36 × 0.65) = 2.14 kW.
Run 8,000 hours per year. Energy use = 2.14 × 8,000 = 17,120 kWh. At an industrial power price of 0.12 USD per kWh, the annual cost is about 2,054 USD. Over five years that is more than 10,000 USD. I
Many plant engineers skip this calculation because they do not own the power bill. But the plant owner does. In practice, we have seen a water utility in the Philippines select a full-bore electromagnetic flow meter because the chart showed 0.03 bar at 250 m3/h. The alternative inline ultrasonic meter showed 0.12 bar. The difference added about 1.9 kW at their duty point.
When Pressure Drop Matters Less
On DN15 to DN25 lines, the flow is small. Pressure drop exists but the energy loss is low. Accuracy, repeatability, and chemical compatibility usually matter more. For a DN15 oval gear meter on diesel at 20 L/h, the pressure drop may be 0.2 bar. The pump load is tiny. You select the oval gear meter because it handles low flow and high accuracy, not because of pressure drop.
For batch operations, pressure drop still matters, but total energy hours are lower. A paint manufacturer in Thailand may run a solvent line 2,000 hours per year. A 0.8 bar loss on a Coriolis meter at 2,000 kg/h may be acceptable because the process needs density and mass flow. If the same line ran 8,000 hours, the extra energy cost would change the decision. A chemical plant in Indonesia with an ATEX Zone 1 area may choose a Coriolis meter for safety and measurement reasons even if the pressure drop is higher.
A Practical Comparison for a DN80 Line
Let us compare three meter types on a DN80 water line at 80 m3/h with a pump efficiency of 0.70. These are typical values from supplier charts.
Full-bore electromagnetic flow meter: 0.02 bar permanent loss. Power loss = (80 × 0.02) / (36 × 0.70) = 0.06 kW. Annual cost at 8,000 hours and 0.12 USD per kWh is about 61 USD.
Inline ultrasonic flow meter: 0.10 bar. Power loss = 0.32 kW. Annual cost is about 307 USD.
Vortex flow meter: 0.35 bar. Power loss = 1.11 kW. Annual cost is about 1,067 USD.
This comparison is not a universal ranking. It shows why the pressure drop chart changes the total cost of ownership. A cheaper flow meter can become expensive after two or three years of continuous pumping.
FAQ
What is a flow meter pressure drop chart?
It is a curve or table that shows permanent head loss across the meter at different flow rates. It is usually given in mbar, kPa, bar, or psi for a reference fluid.
Which flow meter type has the lowest pressure drop?
Clamp-on ultrasonic flow meters and full-bore electromagnetic flow meters typically have the lowest pressure drop. Clamp-on adds zero loss. Full-bore electromagnetic adds very little.
Does higher pressure drop always mean higher energy cost?
Not always. It depends on flow rate, run hours, power price, and pump efficiency. On small lines or batch processes, higher pressure drop may not matter much.
How do I compare pressure drop charts from different brands?
Convert all values to the same unit. Use maximum flow, actual viscosity, and specific gravity. Ask the supplier to confirm permanent pressure loss, not differential pressure.
Can I use water pressure drop data for diesel or syrup?
No. Viscosity and density change the pressure loss. A 100 cP syrup can have much higher drop in a Coriolis or oval gear meter than water. Request a chart for your actual fluid.
Silver Automation Instruments supplies electromagnetic flow meters, ultrasonic flow meters, Coriolis mass flow meters, vortex flow meters, oval gear flow meters, thermal mass flow meters, pressure transmitters, and paperless recorders. We work with water and wastewater plants, oil and gas sites, chemical processors, food and beverage lines, and marine systems. Send us your pressure in bar, temperature in °C, pipe size in DN, and flow range in kg/h or m3/h. We will recommend a flow meter and provide pressure drop data for your duty point.
Tel: +86-25-68650347. WhatsApp: +86-25-52155837. WeChat: +86 15365082610. Website: flow-meter.com.au
 Hot Blog
 Related AD